Problem
- You observe divergence across providers' scores for the same company.
- The score they provide is like a black-box: hard to interpret.
You have subscribed to many ESG data providers, but:
Solution
- Seamlessly design your own proprietary ESG scores with our no-code pipeline.
- You create no-code rules specifying how data is selected, processed, and aggregated into a score.
- Visually inspect each data point constituting your final score: why was it selected, which AI model was applied to it, and how did this AI model make its decision.
- Can also be used for thematic stock-picking.
Problem
- Transform raw data into predictive market signals.
- Pre-process and map to internal financial instruments.
When you try new alternative datasets, it takes time to:
Solution
- We simplify the two most time-consuming parts of processing alternative data: data curation, and signal aggregation.
- Our dashboards let you inspect data while you query the API, for better intuitions and reducing time-to-insight.
- We take care of the mapping to financial instruments: ISIN, BloombergID, OpenFIGI and others.
Products
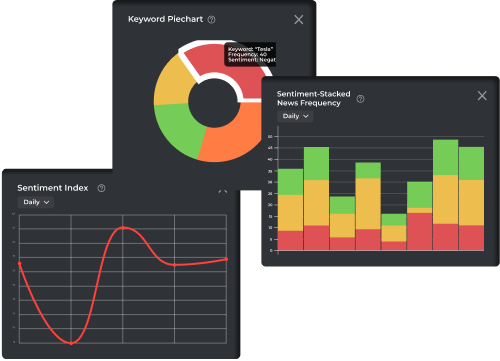
- Search a proportion of relevant articles by keyword over time
- Display computed sentiment of articles daily
- Most positively or negatively mentioned companies or entities in those articles
- Customize and fine-tune more statistics and display them in interactive widgets
- Instantly see the sentiment tone of an article so you know where to pay attention to

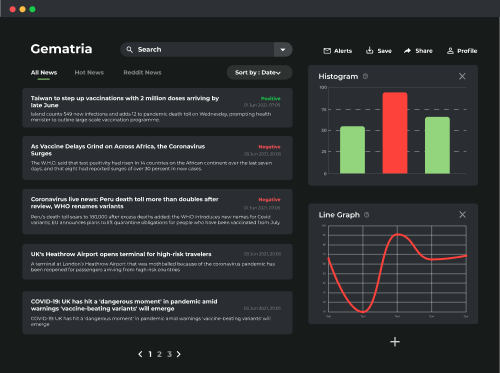
- Customize your search statistics by sources, sector, company, data and many more
- Save your dashboards
- Share your dashboard seamlessly just by copy-pasting a URL
Our team originates from


FAQ
We cover all markets, but only companies covered in English news - for now. Our algorithms are not market specific.
The only part that is market specific is the mapping of detected companies to their financial instruments ID: ISIN, BloombergID, OpenFIGI, etc. If you are working with a different standard, we are happy to add it.
Answering this requires to explain how signals are constructed.
First, we detect entities such as companies, personalities, locations, etc as well as important keywords. Second, we detect their mentions in the text: all words that refer back to them: “their”, “him”, “she”, “its board”, “the company”, etc. Third, we compute sentiment polarities (i) of each sentence and (ii) with respect to each entity.
These last two sentiment signals can be different: for instance the sentence “A wins a suit against B” has a positive tonality (i), but is positive with respect to A and negative with respect to B (ii). Combining all of these yields a lot of sentence-level NLP signals. Now, there are countless ways to go from these many sentence-level signals to a global score for that news article. This is what we call the first level of signal aggregation.
The second level of aggregation consists in combining the scores of many articles into a single daily score, and here again there are countless ways to do it, e.g. weighted averaging depending on sources, authors, co-mentions of other keywords, etc.
Our signals are tailor-made because you are the one designing these two aggregation steps - without coding.
Interpretability happens at two levels.
At a macro level: we let you inspect which articles were selected to constitute each daily value of your signal, and even further, how each entity and sentence was scored inside each article in order to arrive at a final score for this news article.
At a micro level: why did a specific model make this specific sentence-level prediction? We use the SHAP method to let you see the contribution of each word of the input sentence in the decision of the model, so that you can interpret whether its decision was biased by a particular word or not.
Forget about black-box ESG scores or sentiment signals. Take full control.
Yes of course! Our dashboards are here to facilitate the creation of signals, qualitative visual inspections for interpretability, and help your intuition. But you can always access the Python API to directly query history and daily live streams.
Pricing works as yearly licence subscriptions with a 2-months trial and is segmented per pod or project team of 3-5 people. There is no price segmentation per market as our signals are not directly market-specific but are rather entity-specific, and a given entity often impacts different markets. If our pricing does not fit into your budget right now, we can discuss about removing some of the signals.
This is due to the high level of customization that happens when you design your signal. The possibilities are so manifold that it is very unlikely anyone has ever constructed the same signals as you did before, unless you do something very simple like averaging headline sentiments or counting articles with only one specific keyword. For a detailed explanation, please see the answer to the above question: To what extent are the signals tailor-made?
Absolutely. We have already run them on annual reports, customer reviews or social media discussions. We are always eager to try and calibrate them on new data. Hit the “Request My Demo” button and let’s have a chat.
Yes. We understand that you need to be cautious with confidentiality matters and we support a trust-less approach. If the part you wish to run on-premises requires to maintain a GPU infrastructure, we are happy to assist you. Alternatively, we could send you all of our raw data directly.
© 2022 Gematria Technologies Ltd.
Build custom market signals and ESG scores.